Re-Engineering
The Transmission Line
Design Process
Re-Engineering The Transmission Line Design Process
Otto J. Lynch, P.E.
Black & Veatch.
8400 Ward Parkway, Kansas City, MO 64114
(913) 339-7549 (913) 339-2888 Fax
lynchoj@bv.com
Peter Hilger, E.I.T.
The Empire District Electric Company
P.O. Box 127, Joplin, MO 64802
(417) 625-5100 (417) 625-5165 Fax
INTRODUCTION
Traditionally, transmission line design practices have been comprised of conservative assumptions which easily model an elaborate and complex structural system. Continued developments in computers and software have given us the capability of breaking these normally inflexible traditions, and have allowed the industry the opportunity to re-engineer the entire transmission line design process. Finally, the seamless integration of all aspects associated with transmission line surveying, engineering, drafting, procurement, and construction is essential to maximize the full benefits of the re-engineering effort.
Black & Veatch (B&V) is an engineer/constructor headquartered in Kansas City, Missouri. The firm has provided engineering, construction, and related services for electric power transmission and distribution throughout its 80-year history. The firm’s Transmission & Distribution Division forms one of the largest T&D staffs among engineering and construction firms in the United States. By utilizing state-of-the-art resources and techniques, B&V continually strives to improve the transmission line engineering, procurement, and construction (EPC) process to produce better designs in the fastest, most economical manner.
The Empire District Electric Company (E.D.E.) is an independent, investor owned, electric utility providing quality electric service in the four-state area of Kansas, Oklahoma, Arkansas, and Missouri. E.D.E. is dedicated to providing its customers with the highest reliability possible, while maintaining its low rates.
B&V and E.D.E have selected the PLS-CADD software suite developed by Power Line Systems, Inc., Madison, Wisconsin, to support their needs for a "better, faster, cheaper" transmission line design environment. The line design software selected has the capability of meeting all the objectives required for the full integration of the transmission line design and drafting environment.
SURVEYING
Recent developments in surveying technologies have allowed the industry to re-think the station-elevation-offset formats that designers have traditionally used for transmission line profile modeling. Today’s generally accepted method of surveying is some form of three-dimensional geographical information system (GIS) type representation. Data are usually collected in electronic format, and the transmission line software must be capable of reading the data intelligently in any form. Total Station, Geographical Positioning System (GPS), Photogrammetry, electronic topographical maps (USGS), and scanned or digitized existing profile drawings have all been employed to develop quick and relatively accurate terrain models for transmission lines.
B&V and E.D.E. utilize a state-of-the-art technology, the FLI-MAP™ laser mapping system. FLI-MAP was developed by John E. Chance and Associates of Lafayette, Louisiana. This advanced technology system incorporates On-The-Fly (OTF) Kinematic GPS, GPS aided attitude, a reflectorless laser range finding sensor, and a helicopter to quickly gather topographical and other pertinent aboveground data. This method yields about 10 data points per square meter over a 65 meter wide corridor under the flight path. This technology produces points with an accuracy better than 12 cm vertical and 15 cm horizontal of all points on and above the ground. Approximately 100 kilometers of continuous line can be surveyed in a day, and the data can be available in the desired coordinate system and elevation datum on the same day if dictated by the client. The information can then be directly imported into PLS-CADD in a matter of minutes. Transmission line design can commence immediately using extremely accurate profile, significantly more accurate than even a very dense, time and labor intensive ground survey can produce.
The design software selected has the capability of taking any three-dimensional survey format and "cutting" the profiles. The centerline and up to 20 left and right profiles at any offsets can be generated and shown. This process is nearly instantaneous, so Points of Intersection (P.I.s) can be moved or added at any time, and the new stationing and profiles are updated immediately. This allows for the typical last minute reroutes to be made quickly and effortlessly without delays caused by having to wait for new profile surveying, stationing changes, and engineering modifications. Station equations (equalities) will be obsolete.
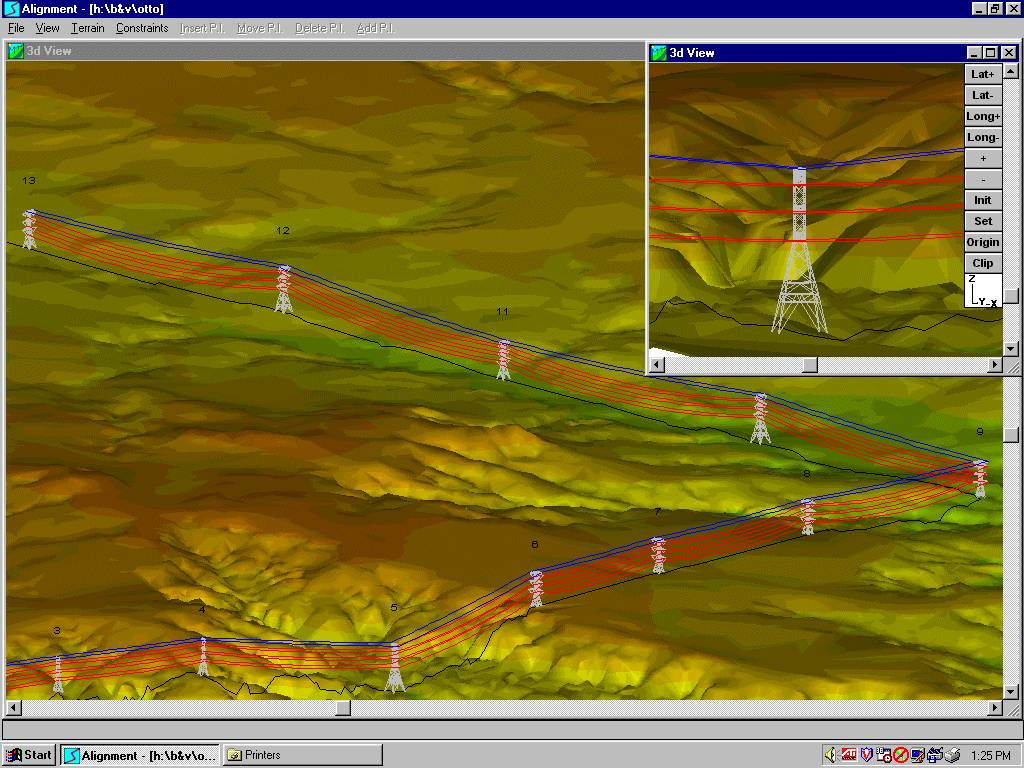
In addition, the software has the capability of creating interpolated points on these profiles by creating a triangular irregular network (TIN). This TIN can also be rendered to present a graphical three-dimensional representation of the transmission line, which can be used for permit and public hearing requirements or any other forum where graphical representations are required of the line (See Figure 1).
Figure 1 - Three-dimensional rendering of a double-circuit 500 kV transmission line.
ENGINEERING
A critical component in any re-engineering effort is the simplification and centralization of all activities. In the transmission line engineering arena, all parameters governing any part of the line design should be available in one common package. Engineers cannot and should not be expected to learn multitudes of software programs, keep current in each of their independent updates, and maintain support with each of the programs. In addition, any data transfers between such programs, whether manual or electronic, leave room for error. Finally, it is critical that the software be on a computer platform that is user friendly and commonly accepted across the engineering and business worlds. Managers, engineers, technicians, drafters, and secretaries should be able to use any form of the programs or their outputs using a common interface, without having to learn complex drafting programs or obsolete operating system languages.
Another area of the software used in the re-engineering process that should not be overlooked is that it be technically sound. Software that merely duplicates assumptions and errors of the past is only as good as those assumptions. In today’s computer environment, these programs will allow an error or mistake to be made faster than ever before. It is imperative that all calculations be made using state-of-the-art technologies and methodologies, and to the highest level of accuracy that is reasonably achievable. These criteria should not be sacrificed in an effort to simplify or expedite the design process.
PLS-CADD allows the engineer to completely design and lay out a transmission line without having to use any other external software. Due to this integration, all design criteria which will be imposed on the transmission line system are developed in one place. Loads which will be used to develop a sag-tension analysis and check sag clearances, uplift considerations, blowout criteria, cable tension limits, insulator swing criteria, structure design, insulator design, guying design, and foundation design are developed in one place. Overload factors (OLFs) can be applied in the transverse, longitudinal, and vertical directions and on the wire tensions. The loads can be selected to be applied to any component of the transmission line system. This allows PLS-CADD to be adaptable to any code or manufacturer requirement where different OLFs are required for each component of the transmission line system.
Structure design and spotting are indicative of the re-engineering effort making tremendous strides. Traditionally, structures have been designed by developing allowable spans, wind and weight, under all the loading cases applicable to the structure. For example, due to terrain factors, a structure family may be designed for a vertical to horizontal span ratio (H/V) of 1.5. Using this criteria, an example tangent structure may have limitations of a maximum wind span of 300 meters and a maximum weight span of 450 meters, where the maximum wind span was probably dictated by an extreme wind condition and the maximum weight span was probably dictated by a heavy ice condition. When spotting this structure on a line, either by hand or by less sophisticated spotting software, the structure location is acceptable if the wind and weight spans are both below the allowable span limitations.
However, in the "real world", the wind and weight spans are rarely maximized simultaneously for any given structure on a line. While we may think that we are maximizing the use of the structure by approaching 100% use of either the allowable wind or weight span, there is actually additional strength available due to the contra allowable span not being utilized to its capacity, thus creating an interaction between the allowable wind and weight spans. Coupling this interaction phenomenon on a loading case by loading case basis, it can be seen that traditional methods used to spot structures can be as much as 70% or more conservative in their application. The associated reduction in structure costs on a large transmission project can quickly translate into a substantial overall project cost reduction.
Weight spans are another area where traditional assumptions are invalid. It has long been standard practice that wind has no effect on computed weight spans. Sags are calculated with the wind loading, templates are developed with the corresponding sags, and these sags are then applied in the vertical plane. This is simply not the case in a three-dimensional environment. When wind is blowing on a span, the conductor assumes a swung-out catenary. In a level span, this swung-out catenary produces a wind and weight span equivalent to that in the vertical plane, so traditional assumptions are correct. In an inclined span, the weight span effect actually shifts and the traditional assumption is no longer valid (See Figure 2).
Figure 2 - A profile and associated three-dimensional view of a line illustrating weight span differences due to wind acting on the wire. All other constants remain the same.
The exact weight span in this swung out condition on an inclined span is difficult to determine by traditional methods of finding low points in elevation views, but computers and three-dimensional technology can easily make these determinations. Using the traditional method, weight spans can be in significant error when considering any wind loaded condition (See Table 1).
The software allows the selection of either the traditional method or exact method for calculating effective weight spans when using the wind and weight span options. It is recommended that the traditional method only be used when comparing PLS-CADD to traditional calculations or on extremely flat terrain. The exact method provides for an accurate three-dimensional line design and should be used on new projects.
|
Weight Span |
Weight Span |
Weight Span |
||
|
Structure |
Wind Span |
w/o Wind |
w/ Wind |
Change |
|
Number |
(m) |
(m) |
(m) |
(%) |
|
31 |
184 |
146 |
102 |
-30% |
|
32 |
230 |
287 |
349 |
22% |
|
33 |
190 |
221 |
249 |
13% |
|
34 |
165 |
183 |
199 |
9% |
|
35 |
201 |
87 |
-19 |
-122% |
|
36 |
232 |
190 |
159 |
-16% |
|
37 |
180 |
190 |
196 |
3% |
|
38 |
164 |
120 |
89 |
-26% |
|
39 |
252 |
428 |
499 |
17% |
|
40 |
242 |
112 |
64 |
-43% |
|
41 |
78 |
99 |
123 |
24% |
|
42 |
53 |
73 |
89 |
22% |
Table 1 - Calculated weight spans from Figure 2. Traditional calculation of weight spans under wind conditions are in significant error and can lead to expensive field problems if not accounted for properly.
Another significant aspect of any transmission line design program is the ability to incorporate the structure analysis of any type of transmission line structure. Important to the re-engineering effort, these structural programs also must be able to accommodate seamless integration into the line design. The PLS software has the capability to perform a full linear and non-linear finite-element analysis of wood, steel, concrete, and lattice structures. In keeping with the previously described criteria that any process in the re-engineering effort be technically accurate, it is essential that the structural analysis be performed as not merely a simplified replication of traditional hand analysis methods, but one that is rigorous. Traditional analysis methods can yield inaccurate results, sometimes on the conservative side and sometimes not.
An example of a simplified and imprecise method is designing single pole structures by calculating and analyzing the groundline moment only. In actuality, the maximum stresses in the pole usually occur at a point somewhere above the groundline, which can be verified by simple statics and observations of actual structure failures subjected to extreme transverse loading. In addition, it is imperative that any guyed structures and extremely flexible structures be analyzed using a non-linear analysis platform. The PLS software meets all objectives required to fully analyze structures correctly.
The current re-engineering movement has made major strides in analyzing existing lines for upgrade capabilities or fiber optic replacements and additions. Traditionally, these analysis are performed by examining the structures independently of their location in the transmission line. Loads that are created by the maximum span limitations are recalculated for the replacement conductors and static wires based on those maximum wind and weight span limitations. Structure modifications are then designed and made to every structure on the entire line regardless of its physical application. However, as described earlier, very rarely are structures placed where the maximum span limitations are simultaneously utilized. By expanding our parameters and factoring in the placement of the structures in the line, we begin to realize those modifications may not be required on every structure. The PLS software has the capability of placing actual structure designs in a line and analyzing them directly on a site-by-site basis. This capability allows a full analysis to be made on the transmission line, allowing modifications to be designed on a structure specific basis using the actual loads that are applied to that specific structure at that specific site (See Figure 3). Considering the gross conservativeness of maximum wind and weight span modeling, many lines analyzed using this method can actually meet significant upgrading requirements with little or no structure modifications being required.
Figure 3 - Finite element structural analysis on an in-line lattice structure using the actual loads imposed on the structure.
Optimization of transmission lines is key to any design re-engineering effort. It is a necessary component for any true line design program. In addition, with many constraints imposed by physical obstructions, land owner desires, and environmental controls, the optimization process must allow for user defined controls to be handled easily. Even on lines where there are many constraints, finding the least expensive combination of structures is still paramount to the project. Constraints usually fall under four categories: prohibited, extra cost, required structure location, and required structures.
Prohibited zones are simply areas where it is physically not possible to put a structure such as driveways, roads, wetlands, and inaccessible areas. Extra cost zones are areas where structures may be placed, but at additional cost to standard construction practices. An ideal example of this situation is a river crossing, where structures in the water are possible but the construction of the water crossing foundations can be a significant factor. Using an optimization routine, it can be determined whether it will be less expensive to place tall river crossing structures on each bank, or to place several standard structures in the river itself. PLS-CADD is capable of finding the least-cost design when accounting for all constraints imposed on the transmission line.
DRAFTING
Transmission line drawings, while being somewhat complex, are very simple in that they are usually repetitious. There are several commercial programs available and many utilities and consultants have written in-house programs capable of incorporating all the various facets of the typical plan and profile (P&P) transmission line drawing. Plan views have P.I.s, structure locations, and often geographical maps. Profile views have terrain profiles, structure specific information such as type, height and stationing, span lengths, clearance requirements, and wire catenaries. In addition, maps are often incorporated into the plan view, which requires placing the proper terrain information on the drawings. In a true re-engineered environment, the drawing generation should be merely an extension of the engineering process, eliminating the need for tedious and time-consuming drawing generation.The P&P drafting of the design software is exactly that - an extension of all surveying and engineering activities. Drawings are formatted to fit client standards only once and include:
All subsequent drawings are automatically generated using these same standards. Geographical maps created in other formats can be imported and placed under the plan view, automatically being cut and placed within the plan view area (See Figure 4). Electronic USGS maps, economically available today for most parts of the US, also are being imported into PLS-CADD. Finally, these drawings can be plotted directly within the software package, eliminating the need for any other drafting program. As an option, drawings can be exported to other popular drafting programs for further customization and archiving in those formats.
Figure 4 - Plan & profile drawing created in PLS-CADD. All design information on the drawing was obtained internally from the engineering process. The geographical map was directly imported and automatically cut and placed in the correct position.
PROCUREMENT
With any large transmission line project, the procurement process can be a project within itself. As a step towards the re-engineering effort, many self-supporting programs and spreadsheets have been developed to tabulate, quantify, and correlate the numerous parts and assemblies that make up the transmission line. PLS-CADD has adapted this ability internally. Parts, assemblies, and even labor units from existing databases can be electronically imported into the software, where the standard structures are associated with the appropriate units. The parts, assemblies, and labor (if used) can then be totaled, creating the structure cost to be used in the optimization process. This approach eliminates the need for the long and tedious process of developing the actual structure cost to use in any optimization program.
Material also can be associated on a specific structure site basis, for construction items such as gates and culverts. A material list can be generated from the line at any time for any section. This is extremely beneficial from the standpoint of determining marshaling yard locations along the line. The material list can be electronically transferred to most spreadsheet and word processing software, eliminating the need for re-entering data and thus preventing the introduction of errors and mistakes. Like drafting, material list generation is an extension of the engineering process.
CONCLUSIONS
Today’s fast moving and economy-driven business environment has dictated that companies, both private and public, cannot be competitive without closely examining traditional design practices and taking full advantage of the tools available to help them overcome limitations. They must make conscious efforts to make paradigm shifts and welcome new ideas, technologies, and practices. The computer is the major tool of the corporate world, and PLS-CADD is the tool that has allowed the transmission line industry to make a major move within the re-engineering effort.
REFERENCES
Reed, M. D., Lynch, O. J., ""Near Field" Airborne Remote Sensing Using A Laser Mapping System on Electric Transmission Line Corridor Surveys and Capacity Analyses", Presented at the Second International Airborne Remote Sensing Conference and Exhibition in San Francisco, California 24-27 June 1996.
This article was published in the Autumn 1996 issue of Power Technology International magazine.
 PLS-CADD Complete line design program