Madison, WI 53719, U.S.A.
Phone: (608) 238-2171, Fax: (608) 238-9241
Email: info@powerlinesystems.com
|
|
5400 King James Way, Suite 300
Madison, WI 53719, U.S.A. Phone: (608) 238-2171, Fax: (608) 238-9241 Email: info@powerlinesystems.com |
| Home News Products |
PLS-CADD is frequently used to model older lines. Sometimes digitized plan & profile sheets can be used to model the profile, the structure locations and the sags for an existing line. The problem with this approach is that old drawings don't always accurately portray the actual structure positions and conductor tensions. If you want to be sure about structure positions and conductor tensions you will need to survey the line.
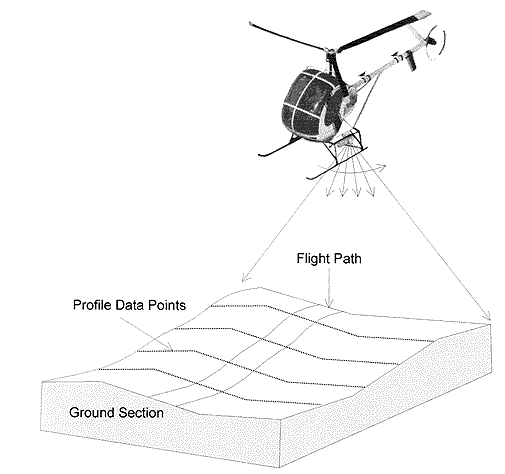
The John E. Chance & Associates, Inc. FLI-MAP™ system addresses this need. The system uses a helicopter mounted laser to scan the line. It records the three dimensional coordinates of millions of points on and around the line while also taking forward and downward looking videos. Chance uses specially developed software to classify these points into ground points, structure points and wire points.
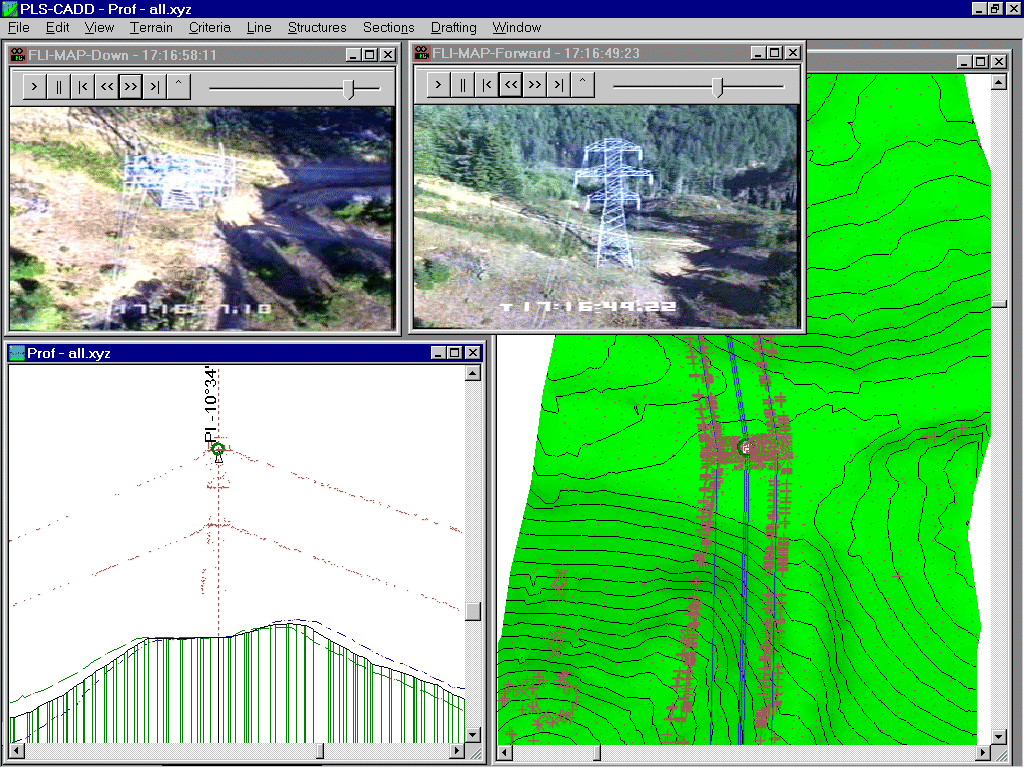
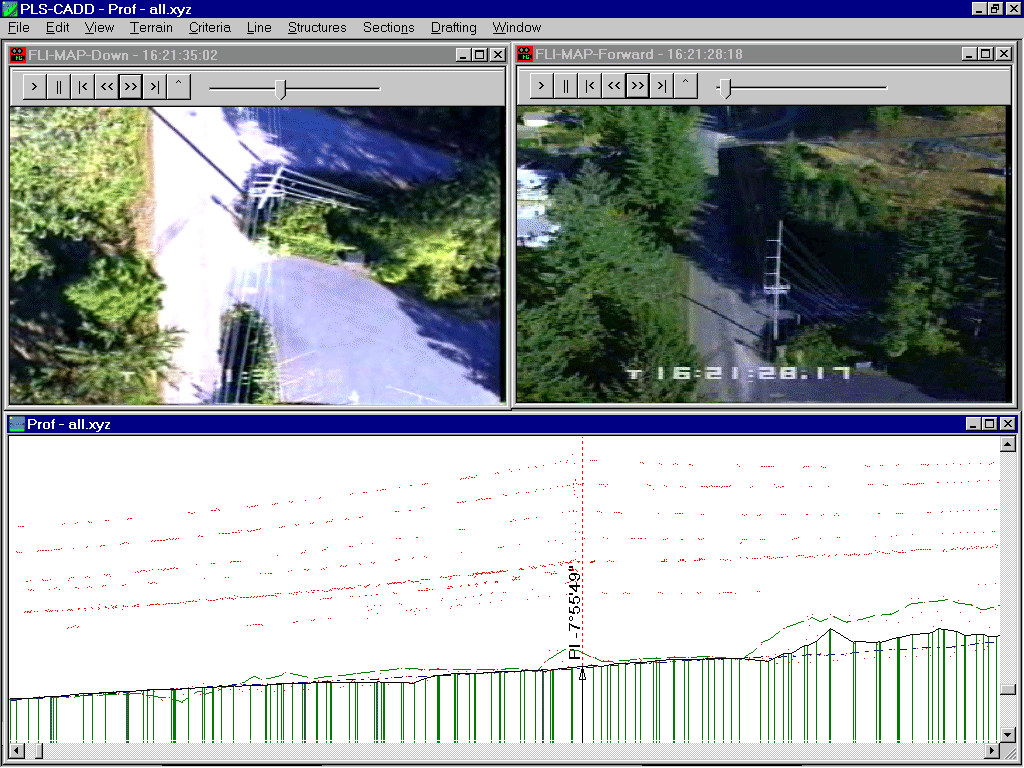
PLS-CADD is the ideal tool for converting FLI-MAP™ data into an engineering model of a line. The data is easily read into PLS-CADD where alignments are defined and profiles are generated. Next you spot structures and string wire using PLS-CADD commands specially modified with the needs of the FLI-MAP™ user in mind. Thanks to a cooperative effort between Chance and Power Line Systems, you can even view the FLI-MAP™ videos from within PLS-CADD by simply clicking on the location in the line that you want to see.
For more information about FLI-MAP™ visit the
John Chance Land Surveys FLIMAP™ web site, or contact Blaine Thibodeaux at 337-268-3282.
The example below shows how FLI-MAP™ data can be brought into PLS-CADD and how an engineering model can be created from the data.
This example is an H-frame line about 8 miles in length. The data set has been processed and reduced by Chance to following four data files (procedure can be modified to include filtering steps if the data set has not been reduced or is too large):
The .PTS files in the list above contain the X, Y and Z coordinates for each point. The sample below shows the first three lines of the GROUND.PTS file:
Note: Starting in January 2000 there may be an additional time stamp column which is used for the video integration feature. When present this column should be read into the PLS-CADD plan view comment field.
The following PLS-COMMANDS were used:
Total elapsed time since start of project: 3 minutes
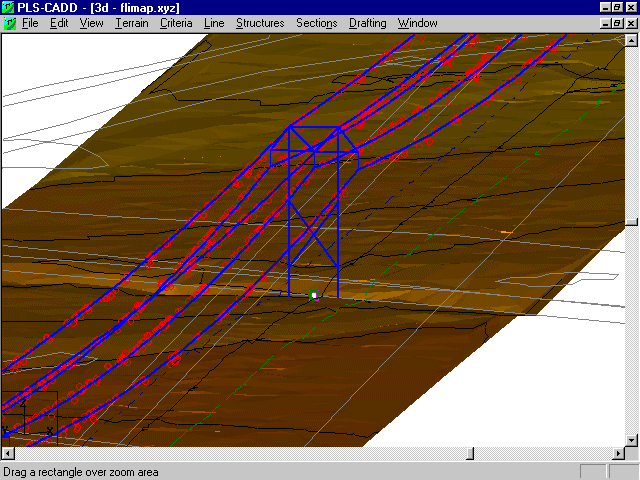
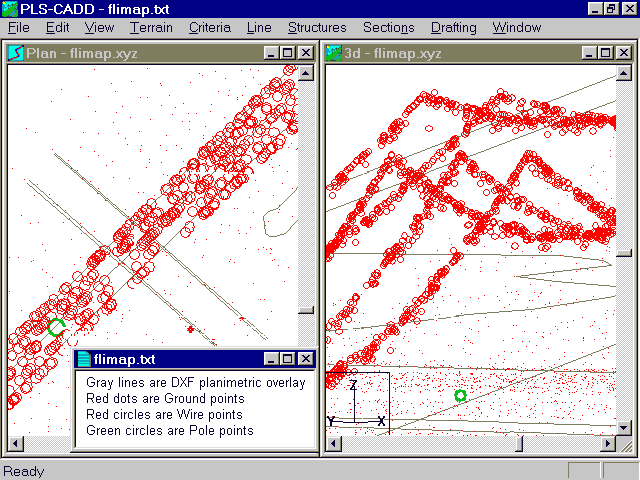 The picture above shows the imported data from two different perspectives. Note how the top geometry of the structure is painted out by the Wire points.
Since we already know the positions of the poles we can construct the alignment automatically by using the PLS-CADD Terrain/Alignment/Automatic Alignment and specifying the feature Pole feature code. Unfortunately this will place a PI at every pole including the tangent poles. This problem is fixed using Terrain/Alignment/Delete Small Angle PI command to remove delete PI points having a line angle less than .2 degrees.
Total elapsed time since start of project: 3 minutes 30 seconds
Use the Terrain/Tin/Create TIN command to generate the digital terrain model. The computer will take a few minutes to create the model due to the large number of points. For this example the entire 200 ft. corridor width was included in the TIN model. Limiting the TIN model to a narrower width would speed up the process and save memory.
Total elapsed time since start of project: 8 minutes 30 seconds
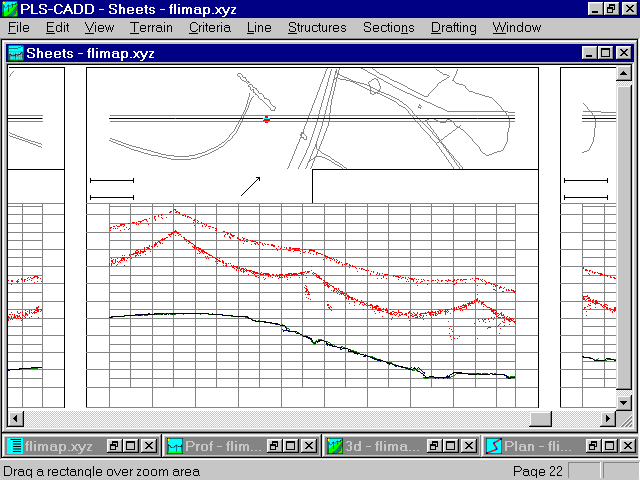
Use the Terrain/Tin/Create Interpolated Points command to create points along the side profiles and centerline. Once the computer finishes calculating the profile is visible in the profile view window and in the plan & profile sheet view.
Total elapsed time since start of project: 10 minutes
Terrain modeling is now complete. P&P sheets can now be drawn in a few seconds even though no structures have yet been placed.
At this stage it is simply a matter of using the standard structure and section commands to spot structures and string wire. The Structure/Height Adjust Snap can be used to make minor adjustments to the structure height so that a designated phase exactly matches a surveyed wire height. Additionally, the Section/Graphical Sag command can be used to sag a section so that it passes through the surveyed wire points.