
|
610 N. Whitney Way, Suite 160
Madison, WI 53705, U.S.A.
Phone: (608) 238-2171, Fax: (608) 238-9241
Email: info@powline.com
|
|
|
Importing USGS DRGs and DEMs into PLS-CADD
Digital data derived from USGS information can be found in many formats and in many places on the Internet both commercially and free, depending on the quality and desired format of the information. This data can be used to develop preliminary transmission line routes, complete with plan & profile drawings and even preliminary line costs
depending on the accuracy of the USGS data. While the information is definitely not good enough to produce Released for Construction drawings, it is excellent for preliminary costing of lines, and even to begin the procurement process, which is a welcome opportunity in today’s fast-paced Just-In-Time engineering and construction environment.
Two formats commonly used are DRG and DEM.
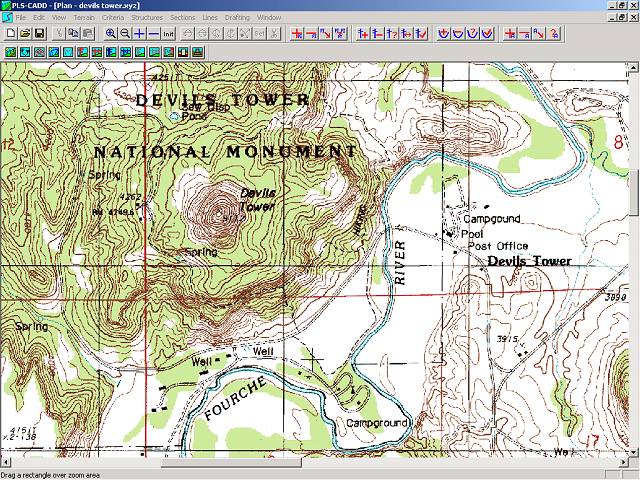
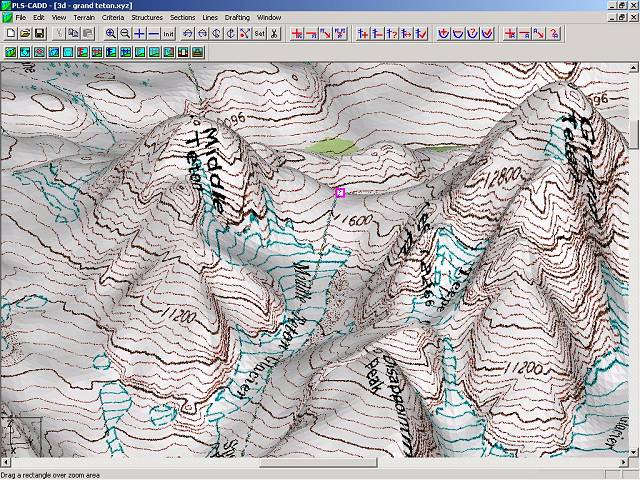
DRG stands for Digital Raster Graphic and is simply a high quality scanned image of a USGS quadrangle "quad" map. A portion of a typical DRG is shown in the PLS-CADD screen shot above. DRGs can come in many different formats:
- Collared: This is the simplest format where the entire quad is scanned, including the collar and any information included in the collar. These types are usually free on the Internet, and can be purchased for minimal prices from various digital mapping companies.
- Seamless: These types of DRG’s delete the collar and it’s content, and provide a way to obtain continuous digital imagery without the information included in the collars.
These types can be found in a few places on the Internet for free, but most sites will require you to purchase them for a nominal fee.
- Orthorectified: These types of DRG’s have already been draped over a DEM file, and have been orthorectified in order to make them as near to perfect as they can be. While this process is a requirement when using full aerial photographical methods on lines, it is overkill for the typical usage of developing a preliminary line design. However, this data is available should you desire it.
Using DRGs, preliminary routes can easily be selected while considering man-made objects, terrain, and even wetland avoidance. Using this method, many routes can be considered very quickly.
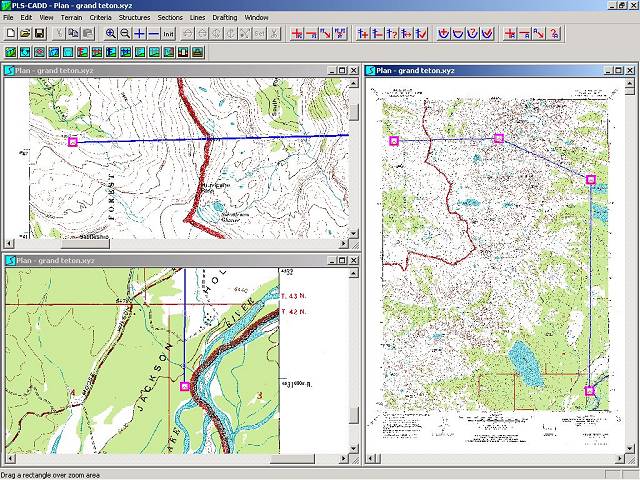
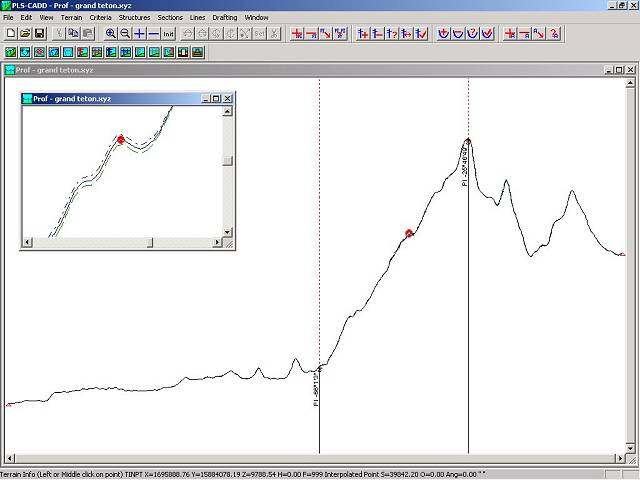
DEM stands for Digital Elevation Model, and is merely a set of points, in XYZ format, that are used to develop the contours that you see on USGS quad maps. These points can be imported into PLS-CADD and a TIN (Triangular Irregular Network) can be created from them. This TIN give us the surface map from which we can then begin cutting profiles over desired routes, including side profiles as illustrated below.
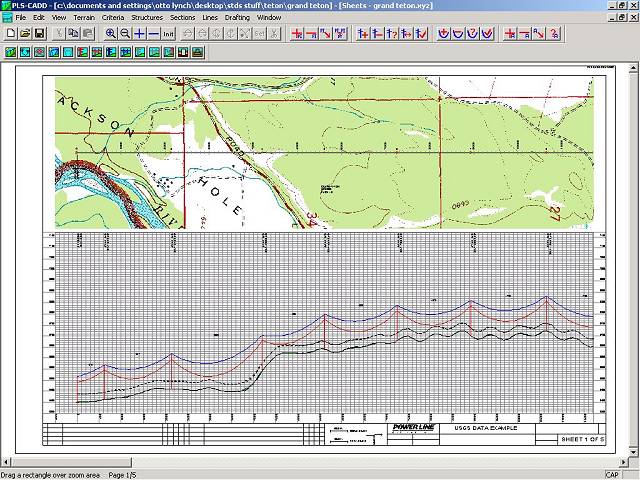
Finally, once the line is designed, Plan & Profile drawings can be made for use with permit applications, public information, and even for bidding by line contractors.
As you can see, this is a very powerful, quick, and accurate way to develop preliminary line designs for various purposes. And the best part about it is that most of the data is free, and can be downloaded from the Internet. You just have to know where to find it and how to use it. The rest of this TechNote will attempt to explain this process.
One suggested free source for any of this data is the GIS Data Depot web site. An index by state can be found at GISDataDepot.com. This includes information for all 50 states plus the District of Columbia. Once you choose the state you want to look in, choose the County Wide data option, then select the county you are working in. You should find the two formats, DRG and DEM, and you may even find the DOQ data where they have it available. There are many different scales available, but the best is 24K, or 7.5 Minute data. This is the densest and most detailed data available. The 24K DEM and DRG files are under the Digital Elevation Models (DEM) - 24K and Digital Raster Graphics (DRG) - 24K hypertext links.
Once entering the DEM link, you will be presented with all the available 24K DEM files available for this county on this website. Quads are listed in alphabetical order, and if your quad isn’t listed, you will have to find another source for this data. Once you have
located your quad(s), click on the “DOWNLOAD” button next to your desired quad name. You will be transferred to a download screen, where you will right mouse click and download the file to your desired target directory. It is suggested that you start a USGS directory
under your PLS projects directory, and you may even want to have county or even quad named subdirectories under this directory for easier referencing. Directions for downloading for your specific browser are listed on this page, and any problems with downloading these files should be directed to The GIS Data Depot, and not Power Line Systems. You may on occasion encounter more than one file for a particular quad – go ahead and download all of them for now. Many times they are just duplicates. Finally, hit the BACK button on your browser to get to the overall county files page, and do the same process as described above to download the 24K DRG files for the quads of your project. These files are much larger, and can take some time to download on slower Internet connections.
An alternate site to download the DEMs is the USGS website itself. However, the DRGs are not available on their website.
If you can’t find the DRGs or DEMs on any of these free sites, you can try several commercial mapping companies. LandInfo, Maptech, ChartTiff, and even the USGS itself are just a few of the many GIS sites you might check out to get this, or similar, information. If you do purchase these types of data, significant discounts can be obtained by purchasing large areas - for example, a single quad may be $50, but orthorectified and seamless DRGs for the entire state of Hawaii cost less than $200. So if you are purchasing this data for a specific project, consider purchasing your entire territory.
Finally, you will need to download some files to decompress and convert this data into readable formats for PLS-CADD. USGS DEM data is in what is called SDTS format, and are zipped into a TAR file. If you are interested in what this format is, you may find out at the USGS web site at STDS Info. You will need a TAR file capable utility (such as WinZip) to decompress the TAR DEM files. A fully functional evaluation version of WinZip can be downloaded directly from their web site. The file that you need to download for converting the data is SDTSEXYZ.EXE. This is a public domain program written by the late Sol Katz of the BLM. It can be found in numerous locations on the Internet, but a suggested location is here. A zipped version can also be found here.
Now that you have all the data, decompression, and conversion files downloaded, the process to get them into PLS-CADD is really quite simple.
- Extract the files from the compressed TAR DEM file into a temporary directory. When opening the TAR file in WinZip, it will ask you “Should WinZip decompress it to a temporary folder and open it?”, to which you should respond by clicking the “Yes” button. If you are using WinZip, you will need to make sure that you have selected the “TAR file smart CR/LF conversion” option under the Miscellaneous tab in the Options/Configuration menu item. Older versions of WinZip (pre 6.0?) do not support TAR compression. When extracting these files, note the first 4 numbers of the files (they should be the same for all the files).
- SDTSEXYZ is a DOS file. You can run this from a common directory, and type the full path of the files in when running it, but I have found it easier to just copy it to your directory where the decompressed TAR DEM files are.
- Double click (execute) the SDTSEXYZ file.
- It will prompt you to enter the base SDTS file name. Enter the 4 digits of the extracted TAR files noted above.
- It will next prompt you to enter the base output file name. I usually just enter the same four digits. Note that you do NOT add any file extension on this.
- It will next prompt you to enter the 2 digits in position 7 and 8 of the base name. The base name is the xxxxCExx.ddf file, and the 7th and 8th digits are usually “L0”, as in the letter L and the number 0.
- It will next prompt you to enter s (for skip) and k (for keep) for fill and void values. This feature allows you to filter out every Nth point, but we normally don’t want to do this, so enter “s”.
- It will next prompt you to enter the output format. We want to choose the letter “t” for triplet. This gives us the X, Y, and Z for all the points. “g” will generate a file compatible with ArcInfo, a popular GIS program.
- After entering the above data, it will then execute the program, and will display some information on the screen such as the UTM (Universal Transverse Mercatur) coordinates of the data and other information. After it executes, you will now have a file in the same directory as the rest of your files called xxxx.xyz, where xxxx is your base file name (or whatever file name you entered under item 5 above). This is the file that you will need to import into PLS-CADD. You may delete all the other files associated with the DEM file at this time, however, we recommend you keep the original TAR DEM file in case you should need to reference it again. Following is a short sample of what this file should look like in text format.
.....
514170 4843770 2885
514200 4843770 2896
514230 4843770 2907
514260 4843770 2920
514290 4843770 2938
514320 4843770 2957
514350 4843770 2968
514380 4843770 2967
.....
- Now, we need to prepare the DRG file for attaching to our PLS-CADD file. The DRG files come zipped (you can use WinZip to extract these files). You will have three files; a TIF, a FGD, and a TFW file. The TIF file is the actual image file, and is usually in GeoTIFF format.
- Extract the TIF image from the zip file and put it in the same directory with your newly created XYZ file.
- Open up PLS-CADD.
- Choose File/Preferences, and choose S.I. for your Units System in the upper left of the dialog box. This is because UTM coordinates are in metric format. Select OK once you have selected the S.I. radio button.
- Choose File/Import/User Defined XYZ. Go to the directory that all your newly created files from above are, and choose the xxx.XYZ file you created. You can double click on it, or just select it and then click the OK button.
- PLS-CADD will warn you that you are importing data as S.I. units. If this is correct, select the OK button. If it isn’t, select the Cancel button, and go back to Item 13 and repeat, selecting the proper unit system you wish to use.
- You will now be at the standard PLS-CADD Terrain Import function. You can select the Import Format and Import Options yourself, or you can download our already developed standard USGS.IMP file to use. To use this file, download it to your selected directory, and then select the Load Setting button in the PLS-CADD Terrain Import function, and then select the USGS.IMP file in the directory in which you put it in. Now you can look at the Import Format and Import Options buttons to see how we have set this up.
- Select the OK button.
- PLS-CADD will ask you if you want to save the import parameters. If you made no changes to the standard USGS.IMP file, then you can simply select the No button. If you did make changes, and you want to save them for future use, then select the Yes button and save the *.IMP file under the name and directory that you choose for future access.
- PLS-CADD will now import the DEM data, and once complete, will tell you how many errors it found in the data. You should have none, but every once in a while you may have one error. Usually this is just one point, and is acceptable for what we are doing here. Select the OK button.
- PLS-CADD will now tell you have one undefined feature code, which we will define later. Select the OK button again.
- PLS-CADD will now draw all the points in the USGS quad in the plan view, and the Import Summary Report will be open below it. You can review the report if you wish to, and then close it without saving it.
- Now set your Feature Codes up as you prefer. You can do this manually, load your standard *.FEA file, or download our default
USGS.FEA file and load it. This can be done by downloading the USGS.FEA file and putting it in your chosen directory, and then selecting Terrain/Feature Code Data/Load FEA File in PLS-CADD.
Locate the USGS.FEA file in your chosen directory, and then double click on it. You will now have a point on every imported USGS DEM point in the quad – roughly one every 30 feet. We have chosen in the downloadable
USGS.FEA file to not show any symbols for the points, but you can see the XYZ coordinates for each point as you move your mouse onto each point. You can turn on and off, or modify the symbols for these points using methods described in the PLS-CADD manual.
- Let’s now overlay the DRG and get a picture so that these points make some sense. In PLS-CADD, select Drafting/Attachments/Attachment Manager.
- In Attachment Manager, select the Attach button, and then find the TIF that you previously extracted and saved in items 10 and 11 above. Once located, double click on it.
- If the image you are using is a GeoTIFF, the numbers in the Bitmap Options dialog box will automatically be imported. (If the TIF image is not a GeoTIFF, the coordinates will be blank. You will need to extract the TFW file in the DRG zip file to the same directory as the TIF directory as described in Items 10 and 11 above. The TFW is what is referred to as a “Real World File”, and is what PLS-CADD (and other GIS programs) can use to put the image in the right place in the world if the TIF image is not a GeoTIFF. The TFW and TIF must have the same base name to work correctly. The TFW coordinates are UTM coordinates, so you will need to be in S.I. units mode in PLS-CADD when attaching images using the TFW option. GeoTIFF images are automatically converted so the units mode is not a factor when attaching GeoTIFF images.)
- Now, put on your seatbelt and click the OK button.
If you selected the same quad for both the DEM and the DRG, they should perfectly overlap each other. You can now begin spotting proposed transmission routes, and getting preliminary Plan & Profile drawings and line costs without ever even having to send a survey crew into the field. This method can be duplicated for each quad involved with your project. Again, properly done, they fall correctly next to each other and you can build the maps for the entire route of your transmission line.
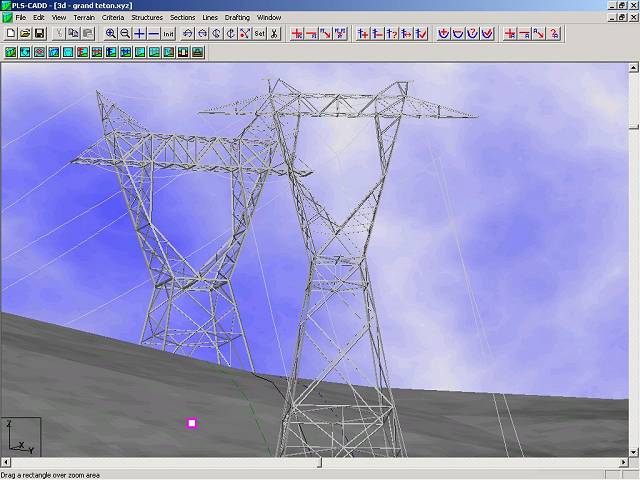
Following is a PLS-CADD screen shot of a TIN created in PLS-CADD with a hypothetical transmission line being designed that crosses between the Grand Teton and Middle Teton mountains in Wyoming.
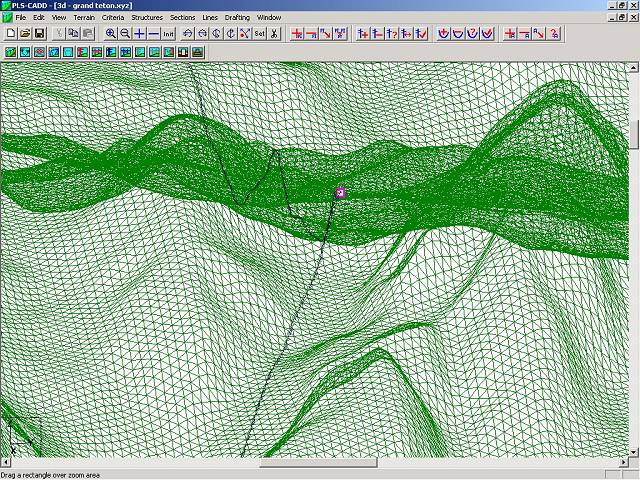
Once you have the TIN created, you can use the TIN rendering options to show the USGS quads draped over the TIN for awesome 3-d renderings, complete with structures if you like.
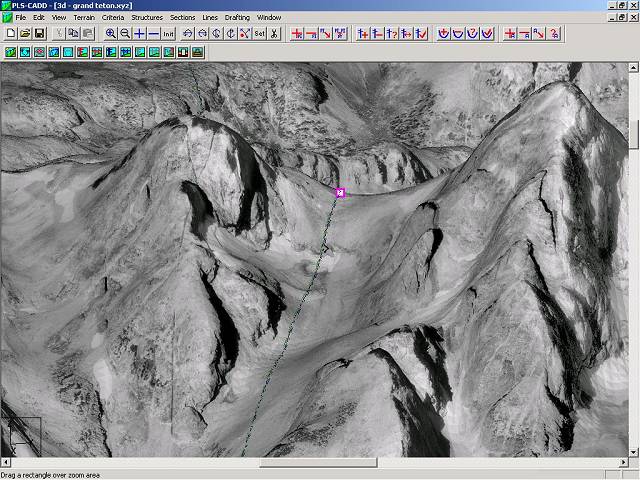
Additionally, while there are not many sites where they can be downloaded for free, DOQs (Digital Ortho Quads) can be used in the exact same way as the DRGs. DOQ’s can be purchased directly from USGS at USGS DOQs. You can get them in black and white, and sometimes even in color.
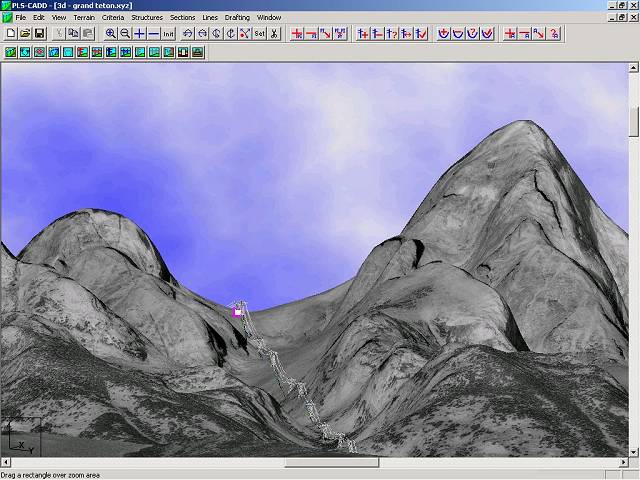
The DOQs can then be draped over the TIN to create nearly photo realistic views of your transmission line.
When our structure programs, PLS-POLE or TOWER, are used to model the structures they can be drawn with a true graphical representation as well.

© 2000 Power Line Systems, Inc. All Rights Reserved.