Madison, WI 53719, U.S.A.
Phone: (608) 238-2171, Fax: (608) 238-9241
Email: info@powerlinesystems.com
|
|
5400 King James Way, Suite 300
Madison, WI 53719, U.S.A. Phone: (608) 238-2171, Fax: (608) 238-9241 Email: info@powerlinesystems.com |
| Home News Products |
The Danger Tree Locator (DTL) feature in PLS-CADD was originally developed in 2002 in cooperation with British Columbia Hydro (BCH). British Columbia Transmission Corporation (BCTC) took over responsibility for management of the BC transmission system after this project was started and many of the people involved are now at BCTC. BCH was looking for a safer, more reliable and less costly alternative to existing vegetation management procedures. They were interested in identifying danger trees that were too close to their wires and trees that could contact the wires if they were to fall. Existing procedures relied on field personnel “guesswork” predictions for wire positions under maximum operating temperature and high wind. Inaccuracies in these guesstimates result in failure to cut danger trees and or excessive cutting of non danger trees. Their goal was to perform a LiDAR survey to collect points along wires and trees and then feed this into PLS-CADD for accurate danger tree classification. PLS-CADD would be responsible for predicting wire positions under different combinations of wind, ice and operating temperature. PLS-CADD would then compare these wire positions against the surveyed tree points and identify those that were too close to the wires. The project was a success with BCH personnel declaring "the LiDAR/PLS-CADD system is the best thing to hit transmission vegetation management since the chain saw". For more background on BCH's experiences please see the related articles published in Transmission & Distribution World listed at the top of this page.
Sample PLS-CADD plan & profile sheets with danger tree graphics (courtesy of BC Hydro)
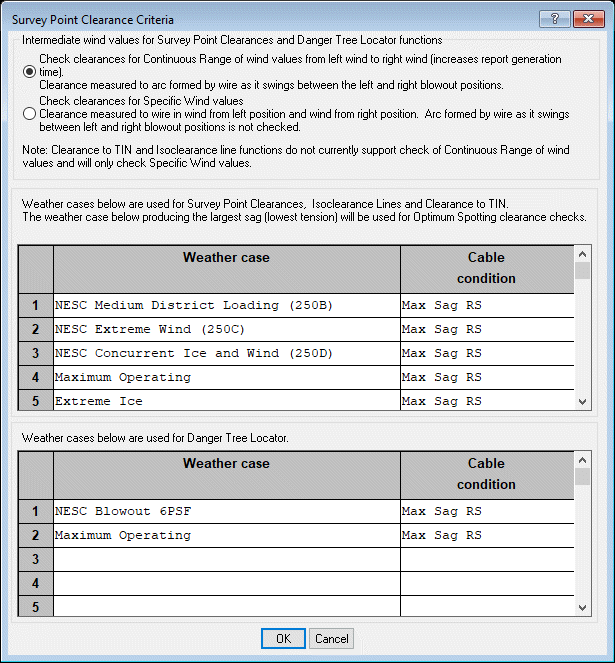 The Danger Tree Locator (DTL) feature can check up to 200 weather cases (combination of wind, ice and wire temperature).
These weather cases are shared with our Survey Point Clearance Criteria function and are defined under Criteria/Survey Point Clearance and Danger Tree Locator... (see dialog box pictured to right).
DTL automatically checks clearances to wires in the wind from left and wind from right blowout positions and can also check the arc through which the wire swings between these positions.
DTL can even consider unbalanced ice scenarios where a span is subjected to more ice than neighboring spans (“Add optional concentrated load or ice to the span under consideration” option).
This results in additional sag as suspension insulators swing into the more heavily iced span.
The Danger Tree Locator (DTL) feature can check up to 200 weather cases (combination of wind, ice and wire temperature).
These weather cases are shared with our Survey Point Clearance Criteria function and are defined under Criteria/Survey Point Clearance and Danger Tree Locator... (see dialog box pictured to right).
DTL automatically checks clearances to wires in the wind from left and wind from right blowout positions and can also check the arc through which the wire swings between these positions.
DTL can even consider unbalanced ice scenarios where a span is subjected to more ice than neighboring spans (“Add optional concentrated load or ice to the span under consideration” option).
This results in additional sag as suspension insulators swing into the more heavily iced span.
| |
 DTL does checks for grow-in violations and/or falling tree violations.
When checking for grow-in violations the program looks for tree points having actual wire clearances that do not meet the preset Horiz. and Vert. clearance requirements.
The clearance requirements are entered in Terrain/Feature Code Data/Edit... and may include components for flashover or minimum approach distance, buffers for LiDAR accuracy and growth allowances.
When checking for falling tree violations the program assumes trees will pivot about a root ball.
The size of the root ball is calculated automatically as a user entered percentage of tree height.
A violation is indicated if the top of the tree can swing within the specified Clearance Allowance of a wire.
The clearance allowance should include flashover clearance, growth allowances and any extra buffers desired.
DTL does checks for grow-in violations and/or falling tree violations.
When checking for grow-in violations the program looks for tree points having actual wire clearances that do not meet the preset Horiz. and Vert. clearance requirements.
The clearance requirements are entered in Terrain/Feature Code Data/Edit... and may include components for flashover or minimum approach distance, buffers for LiDAR accuracy and growth allowances.
When checking for falling tree violations the program assumes trees will pivot about a root ball.
The size of the root ball is calculated automatically as a user entered percentage of tree height.
A violation is indicated if the top of the tree can swing within the specified Clearance Allowance of a wire.
The clearance allowance should include flashover clearance, growth allowances and any extra buffers desired.
| |
 Violations in report form with listing of number of grow-in and falling tree violations in each span along with inset plan and profile graphic for each span
| |
Grow-in and falling tree violations in 3D view
| |
Grow-in and falling tree violations in plan & profile sheet view with optional plan grid to make measuring violation offset from centerline easier
| |
Grow-in and falling tree violations in plan view with wire displayed in hot position
|
|
 Grow-in and falling tree violations in plan view with wire displayed in blowout position
|
|
 Grow-in violations in cross section view with wire displayed in blowout position
| |
Falling tree violations displayed in cross section view with wire in hot position
|
Isolines are polylines that connect points of equal value. Ground elevation contours are isolines where the points along the lines have the same ground elevation. Isoclearance lines are similar but the points all have the same distance to the closest wire rather than the same elevation.
Wire position varies with wind, ice and temperature. PLS-CADD can generate isoclearance lines for any given combination of wind, ice and temperature and can also generate a composite isoclearance line representing the worst case clearance to a range of up to 100 different wind, ice and temperature combinations (same assumptions as in Danger Tree Locator shown above).
We developed the isoclearance line feature in 2004 after discussions with Bryan Hooper of British Columbia Transmission Corporation. Bryan introduced us to the concept of the isoclearance line and explained how to use them to identify different areas of interest. The areas include:
 10' interval isoclearance lines in 3D view. Required clearance to 500kV wires is 40'. Can you spot the clearance violation?
|
 1' interval isoclearance with program hiding lines with clearance in excess of 40'. Clearance violation is now clearly visible. We see only 2 lines we know the violation is less than 2' in magnitude. Since it is only a 2' violation contained to a relatively small area it is a good candidate for remediation by re-grading of ground.
|